By using simulations on real data, we can discover how much an unpredictable schedule leads to unpredictable project length.

Not all business days are created equal
Suppose you are given a software project, and are asked to make an estimate on how long it will take to complete.
…
…After you’ve finished laughing or crying, go ahead and continue reading the article.
And, suppose you do some thinking, and then decide that it will take around 10 business days to complete, give or take a few.
OK, then, you work on the project, and finish it, but it didn’t take 10 business days to complete… It took 8! Or, maybe it took 13. Or 20.
Something that wasn’t 10.
Why?
I mean, you’re a god of software development. You always know the exact amount of work needed for any project. And, obviously, you never have unexpected difficulties, unclear requirements, or changes in energy or morale. All the random variables are out of the equation!
(Yeah right. But, roll with me here, let’s assume the above is true.)
So what happened?! Let’s retrace your steps.
Presumably, you first came up with an estimate for the amount of work, in your head. Then you probably converted it to an irreducible unit of time, let’s say, X total hours of work.
But, the business wanted it in business days. So you figured, “Well, on average, I get about Y hours of work done on a project, each day (give or take a few).” So you took X divided by Y, and got Z business days.
But there’s the problem! Not all business days are equal. They’re random. You forgot to consider the variance of how many hours you work on a project each day. The “give or take a few”. Is it consistently close to Y hours of work in a day, or does it vary wildly, is it often 1 hour, and sometimes 8 hours, and it just averages out to 4, only in the grand view?
But, how much could that “daily variance” actually effect the variance of the whole project’s length, anyway? Could it really vary the project length much?
Let’s continue to ignore the other random variables that affect a project’s length, and focus on this “unpredictable daily schedule” variable in particular, because, I have been collecting data about the unpredictability of my schedule…
…and we can use that data, to know how much of an effect it has on the inaccuracy of my estimates!

Recording my data
For the past 14 months, I have recorded and categorized where my time is going, for every minute of my day at work.
Here is an example: an actual day!
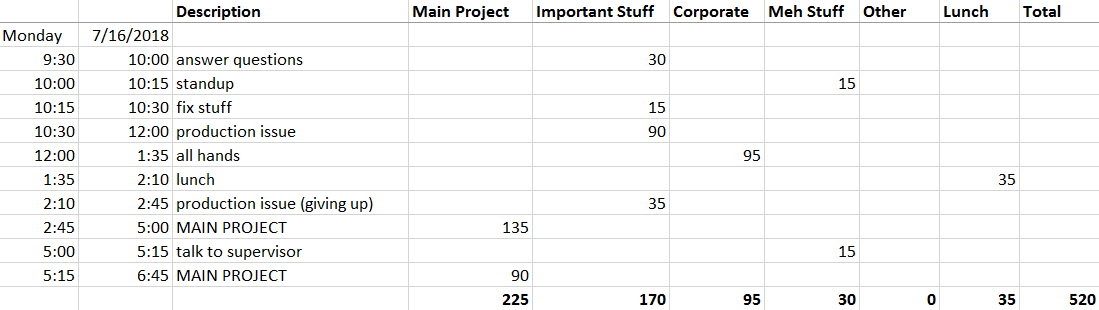
The day is segmented into parts, and each part’s minutes are put into one of six categories. Most of the categories are not important to this article, but I’ll quickly explain them, for the interested.
If I’m doing something I think is important, but isn’t my “Main Project”, then I’ll put those minutes into the “Important Stuff” column. If I’m doing something for corporate, like a survey or an all-hands meeting, those minutes are added to the “Corporate” column. If the time is spent on something someone wants me to do but I kind of think it is waste, like most meetings, that’s in the “Meh Stuff” category. “Lunch” is lunch. Anything else like walking around, warming up my cold hands, or socializing, is in the “Other” category.
So, looks like I was a bit of an introvert on July 16, and my hands were not that cold. Very unusual–my hands are usually freezing.
Our main concern in this article is the time spent in the “Main Project” category. On July 16, looks like I spent about 225 minutes on my main project.
It just so happens that, for me, 225 minutes is pretty close to normal. Looking across all the days I have recorded so far, the average time spent on my main project each day, is 200 minutes (which is, 3 hours and 20 minutes).
By the way, what do I mean by “Main Project”? On my team, each developer typically has an assigned “Main Project” that they are working on, and giving a lot of estimates for, but the developer typically has other responsibilities like production support, maintenance/upkeep tasks, meetings, etc.
The variance of my schedule
So, my average time spent on my main project each day, is 200 minutes.
But it’s the nature of my job that it actually varies a lot from 200 minutes. It is often not anywhere near 200 minutes.
A great way to visualize this variance is a histogram. This is a bar graph where we put each day into a bucket: we count all the days where I got 0–50 minutes of work done, that’ll be the 0–50 bar on the bar graph. Then we count all the days where I got 50–100 minutes of work done, that’ll be the next bar on the bar graph. And so on.
Here is that histogram:

Example: There were 39 recorded days where I worked 0–50 minutes on my main project.
It’s very random looking, a lot of variance. But, you can see a central tendency around 275 minutes, with thick tails to the left and right. My actual mean is 200, not 275 minutes.
There are more details about how the data was collected, in the appendix of this article.
I only have data about myself, of course, but I’m very curious about other developers. Are there developers with little variance, and each day they work on their main project consistently close to some average?
Until I started collecting data, I thought I was one of those developers. But it turns out, I am not. And if you think you are, maybe you aren’t either. In fact, maybe yours has even more variance! It’s hard to know. I look at developers around me, and suspect that about half of them probably have more unpredictable schedules!
After all, don’t we all have questions to answer, code to review, people to talk to, production fires to fight?
Simulating project length
OK here’s the good part.
Suppose I’m given a project, and I think about it and decide it will take 2000 minutes to complete. On average, I know from my data, that I do 200 minutes per day on a main project, so the expected length of the project is therefore 10 days, give or take a few depending on luck.
I can use my real data, to simulate how many days the project will actually end up taking. And I can simulate it over and over, to see how often and how much it varies from the expected length (10 days).
(Remember, we’re still “assuming” I’m a god developer and all the other random variables don’t exist.)
Here’s an example single run of the sim: On day 1 of the project, we randomly select a day from my dataset, and take its “number of minutes on my main project”. OK, we got 150 minutes. Have we reached 2000 total minutes yet? No? Then go on to day 2. Again, we randomly select a day from my dataset. OK, we got 300 minutes. Have we reached 2000 minutes yet? No, only 450 so far. …And so on. Eventually, halfway through the 8th day, we reach 2000 minutes. Therefore on this run of the simulation, it took 7.5 days to finish the project (we only needed half of day 8).
That was one run, but what we really want to do, is record that we finished on “Day 8” in a histogram, and then do 1 million more runs of the simulation, and record each result in the histogram.
Hopefully you can see the intuition of why this simulation works: how much “main project” work I do in a day is a random variable, but my collected data captures the distribution of that random variable. If I have a lot of “0 minute” days, then my dataset will reflect that, and so the simulation will randomly select 0 minute days often. If my collected days were pretty consistent, then the simulation would randomly select days that are consistent. And so on.
Simulation result
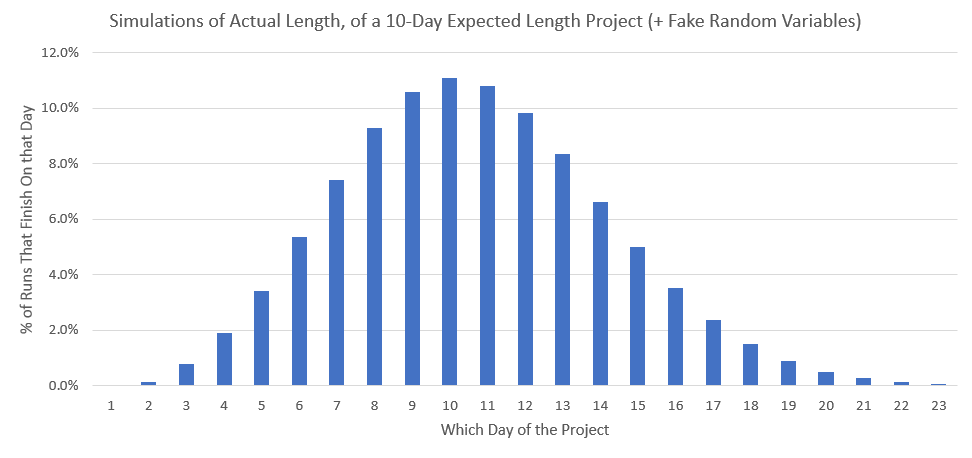
Anyway, here is the resulting histogram for simulating this approximately 10-day project, using my unpredictable schedule, finding out how long it could actually take:
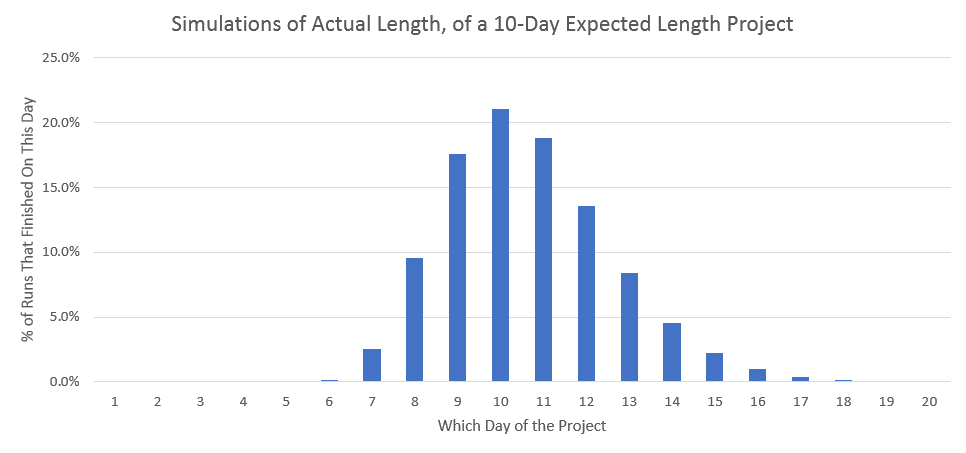
Gorgeous! Right? Here are some examples of fun observations to make.
- 60.1% of runs are ±1 or more days away from the expected 10 days.
- 95% of runs take between 7.0 and 14.5 days, to complete.
That last observation is also known as the “Two-tailed 95% confidence interval” of my project’s length.
Initial reaction
So, are you surprised? Or does it look about right to you?
For me, I was surprised. I definitely thought the variance of project length was wide, sure. Wider than this, even. However, I mostly think about sources of variance like “unexpected difficulties”, “unclear requirements”, that sort of thing. I didn’t think an “unpredictable schedule” was a big deal.
And yet, the project variance is already this huge without considering those obvious other sources of variance! If we were able to include those as well, this graph would be even wider! Kinda mind-blowing.
Many software developers who need to report estimates, prefer not to report the expected average length (10 days), and instead prefer to give the 95% confidence interval (7.0 to 14.5 days in my case). The above graph and observations probably demonstrate why: the estimate of 10 days really doesn’t tell us much, since it’s incorrect by 1 or more days in 60.1% of cases! Perhaps these developers have a good intuition for the vast randomness of software development.
But just look at the size of that 95% confidence interval, it’s 7.0 to 14.5 days of work! If you give an estimated range like that, there are people who will give you dirty looks. I reckon that many people get shocked that the second number is two times the first number, which seems like 100% error, or something like that. They aren’t visualizing the bell curve shape and tails.
Perhaps that is why many software developers prefer to just report the right-end of the interval (14.5 days). The truth can be scary.
And yet, in reality, with all the other random variables, this graph would probably be much wider. Maybe absurdly wide…it makes me think there is no such thing as estimating, really…
It makes me think, that there is no such thing as “being fairly sure a project will finish by X date”. There is only setting a reasonable limit, and working up until then. If you do finish before that, great, you got lucky. If you don’t, that’s common, just try to have something working reasonably well when you hit the negotiated limit…because otherwise, you might be working shockingly longer than you ever wanted to.
That’s just my reaction though, maybe yours is different! Think about it!
An important takeaway
There’s an important thing I think this experiment shows nicely.
When a project is far off from its estimate, it is often blamed on the developer’s estimation skill — if they were better at estimating, they would have been closer to predicting the real completion date.
But in this experiment, we’re taking estimation skill entirely out of the picture. We’re taking all skills out of the picture! We’re guaranteeing the actual project length in minutes is known and constant. 2000 minutes. And yet, we can see, the error can be quite large anyway! Because there is inherent randomness in software development.
When you roll a six-sided die, and you give an estimate of 3.5, and you end up rolling a 6, that doesn’t mean you estimated poorly. You estimated perfectly, 3.5 really is the average expected value. There is just inherent randomness in the act of rolling a six-sided die. You should be blaming that inherent randomness, not blaming the estimate.
You can claim after the fact, “well you should have known the the project would go that route, I see no randomness, just ignorance”, but that has the same flaw as saying “well you should have known the die would bounce that way, I see no randomness, just ignorance”.
Even the make-believe god of software development cannot guarantee the actual project length will match the expected project length. There is inherent randomness in software development. For many of the random variables, it is hard to prove that the randomness is innate and unremovable, although nearly any software developer knows the intense randomness exists. But the “unpredictable schedule” random variable is a really useful one to study, since it’s so plainly visible, and so easy to show how much it affects project length.
Estimation skill probably does exist, but it is only one of many random variables, and there is no reason to blame estimation skill any more than the other random variables, when a project’s actual length differs from the estimated.
…On the other hand, sometimes people say “estimation skill” and they’re actually talking about estimating the variance of the project length — estimating how long the right tail is, of the 95% confidence interval. I think that is more reasonable to talk about. We should all be studying and trying to get really good at understanding how much randomness there is in software development. That’s exactly what this experiment is trying to do, after all! Getting a decent feel for how much one particular random variable can add variance to project length.
(By the way, I suspect in general, most disagreements about “estimating” are really caused by the confusion between estimating the “average expected length” and the “right tail size, of the 95% confidence interval”. Every time you have a discussion with someone about estimating, I recommend you figure out if you’re even talking about the same thing!)
OK, the rest of this article is just more fun with these simulations, and eventually, moving slowly away from the realm of science.
The same simulation on different project lengths
OK, I used my schedule data to simulate a 10-day expected length project. …Let’s also try it on some other project lengths!
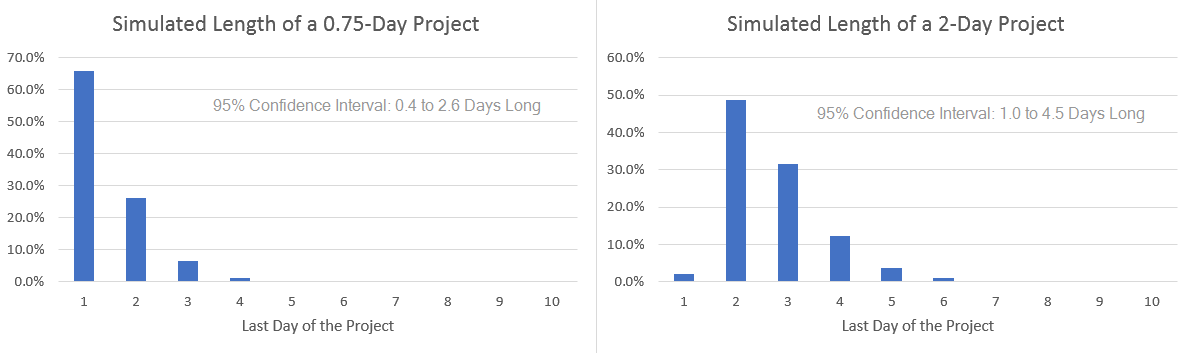


Whew! That was gratuitous!
Once again, those are ignoring all random variables except for my collected unpredictable schedule data.
I like that 20-Day Project result: 3–5 weeks is an easy to remember range for a 4-week-expected-length project.
Fake data for a more consistent schedule
Just for fun, let’s try constructing some fake data for a developer with less variance in their schedule than me.
To do it, I removed 70 of the more extreme data points from my 222 data points. I used no mathematical strategy, I simply tried to greatly reduce the thick left tail on the histogram, and make it look more like a bell curve shape. Here is a histogram of the fake data.
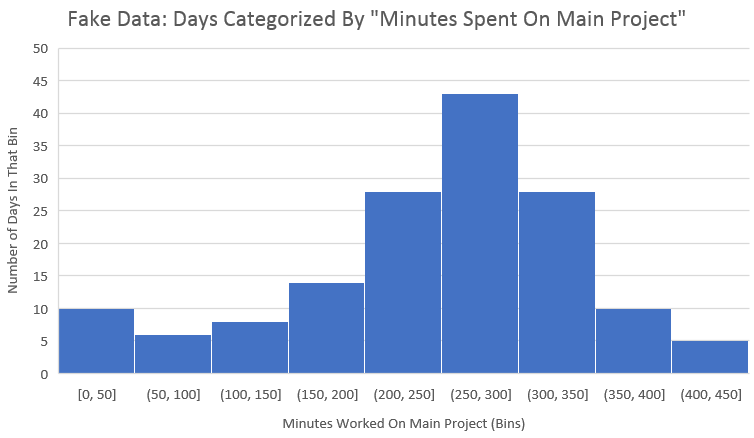
Hopefully that looks reasonable enough. It much more resembles a bell curve than my real data, which almost looked like a uniform distribution (die roll).
And now, let’s do 1 million simulations of a 10-day project again, using the fake data that is more consistent. Here is the result:

Here are some observations this time:
- 41.7% of runs are ±1 or more days away from the expected (instead of my 60.1%).
- 95% confidence interval: 8.0 to 12.9 days (mine was 7.0 to 14.5 days).
So, sure enough, there’s less variance, but more than I would have expected before starting this experiment.
Adding back in other random variables
Remember, project length is affected by many random variables that cause variance, but all the above simulations in this entire article only consider the “unpredictable schedule” random variable.
But just for fun, we can take a guess at how much the other random variables affect project length, and then run the simulation again and include that randomness!
Let’s identify some other random variables and invent how much they add/subtract to project length:
- Unexpected difficulties: Sometimes projects take longer or shorter because of unexpected technical difficulties or unexpected easy parts. Let’s say, 33% of projects take 20% longer, and 33% of projects take 20% shorter. This is certainly conservative, we’ve all had projects where we realize they’re twice as hard as we thought…but whatever.
- Unclear or changing requirements: Sometimes projects take longer or shorter because of requirements that are required but not revealed until during the project. Let’s say, 33% of projects take 20% longer, and 33% of projects take 20% shorter. Also probably conservative?
- Energy and morale: Sometimes a project is particularly tedious, or you just have other stuff going on in your life. Or sometimes you’re super into it. Let’s say, 33% of projects take 10% longer, and 33% of projects take 10% shorter. Also probably conservative — personally, when the open office is quiet, and I’m in the zone, and I don’t have ten things I’m trying to remember before the end of the day, I work blazingly fast…
- Estimation skill: Whenever we guess we’re on a 2000 minute project, we don’t know that. We guessed, and we don’t have perfect estimation skill. We might actually be on a project that will take on average 1700 minutes, or 2300 minutes, or whatever. So for 33% of projects, let’s add 20% more work, and for 33% of projects, let’s subtract 20% of the work. No idea if this is conservative or not.
So now, for each run, we’ll still start with 2000 minutes (10 full days), but then we will compute the above random variable additions & subtractions and modify that 2000 minutes. Then we will actually simulate the day 1/2/3… of the project by sampling my schedule data, just like before.
Here it is:
- 78.0% of runs are ±1 day or more away from the expected (instead of original 60.1%).
- 95% confidence interval: 3.9 to 17.5 days (original was 7.0 to 14.5 days).
Many software developers recommend that if you are asked to choose a date and commit to it, on a project, then: you should “take your estimate of the expected average length, and double it, and that’s your commitment date”. Looking at the above graph, that seems like a reasonably good call. Although, I think most developers tend to underestimate the expected average…so those developers should probably triple the length instead of double it.
Appendix: Rules for data gathering
Here are some important rules I used for recording data and choosing to include it in this experiment:
- If I took an unexpected day off, then that still got recorded as a “0 minutes worked on my main project this day”, and still got included in this dataset. So, sick days, for example. Out of the 25 “zero minute” days in my dataset, there were probably only about 10 of these (the others were days where I just got interrupted too much, presumably).
- If I took a planned day off, like if I knew I was taking that day off whenever I last gave an estimate/commit date for the project, that day was not recorded at all and not included in this dataset.
- There were small periods of time where I was not assigned a “main project”, I was just in-between projects, doing whatever. These days were not included in this dataset (I did record them somewhere in case I want them some time though). This doesn’t happen often.
- There was one large project that was clearly an outlier from other main projects I’ve worked on, and so that time period was not included in this dataset. It was a project I was passionate about and had a strict business-driven deadline. If I had included it, my schedule’s variance would have been even more extreme and would have proved my point further, but it would have felt like cheating.
Strictly speaking, to do a statistical study like this, each data point should be independent of the others. My data is probably not actually entirely independent — surely there are interruptions that recurred over multiple subsequent days. But, I think it’s close enough, you can take a look at a scatter plot, to give it an eyeball test for independence:

Pretty darn random, but not entirely random. But, I suspect true independence is rarely perfectly achieved anyway, for most statistical studies about real life.
